matplotlib图形绘制

类似于 gnuplot , matplotlib 也是开源的图形绘制软件。

需要使用到的工具如下:

  • Jupyter:python 分布调试 和 Markdown 笔记记录一体化工具。
  • Python3.10
  • Python3 插件: matplotlib / pandas
  • VS code 所需插件: pylance

其中, matplotlib 是绘图所用的开源工具库,而 pandas 是文档管理的 “瑞士军刀”。

环境安装

JUPYTER 安装

Jupyter可以支持在线和离线使用,在线即以网页形式支持使用,可以在服务器上进行部署。离线即在 Visual Studio Code 中以插件形式提供安装和使用。

在线安装

以 Ubuntu 系统为例,可以用 apt 进行安装,也可以用 pip (或 pip3 )进行安装。

1
sudo apt install jupyter

在线版 Jupyter 还需要安装一个 ipyparallel 的类:

1
2
pip3 install ipyparallel
ipcluster start

远程访问配置项

参考 《ubuntu 安装Juypter并设置远程访问》对 服务器端 Jupyter进行设置和访问测试。

相关防火墙设置 / 证书 / 域名 不再赘述。

自启动配置

另外,Linux 服务器端 Jupyter 用 jupyter notebook 命令启动,无法开机自启,需要参考 《Linux下Jupyter开机启动设置》 进行设置。

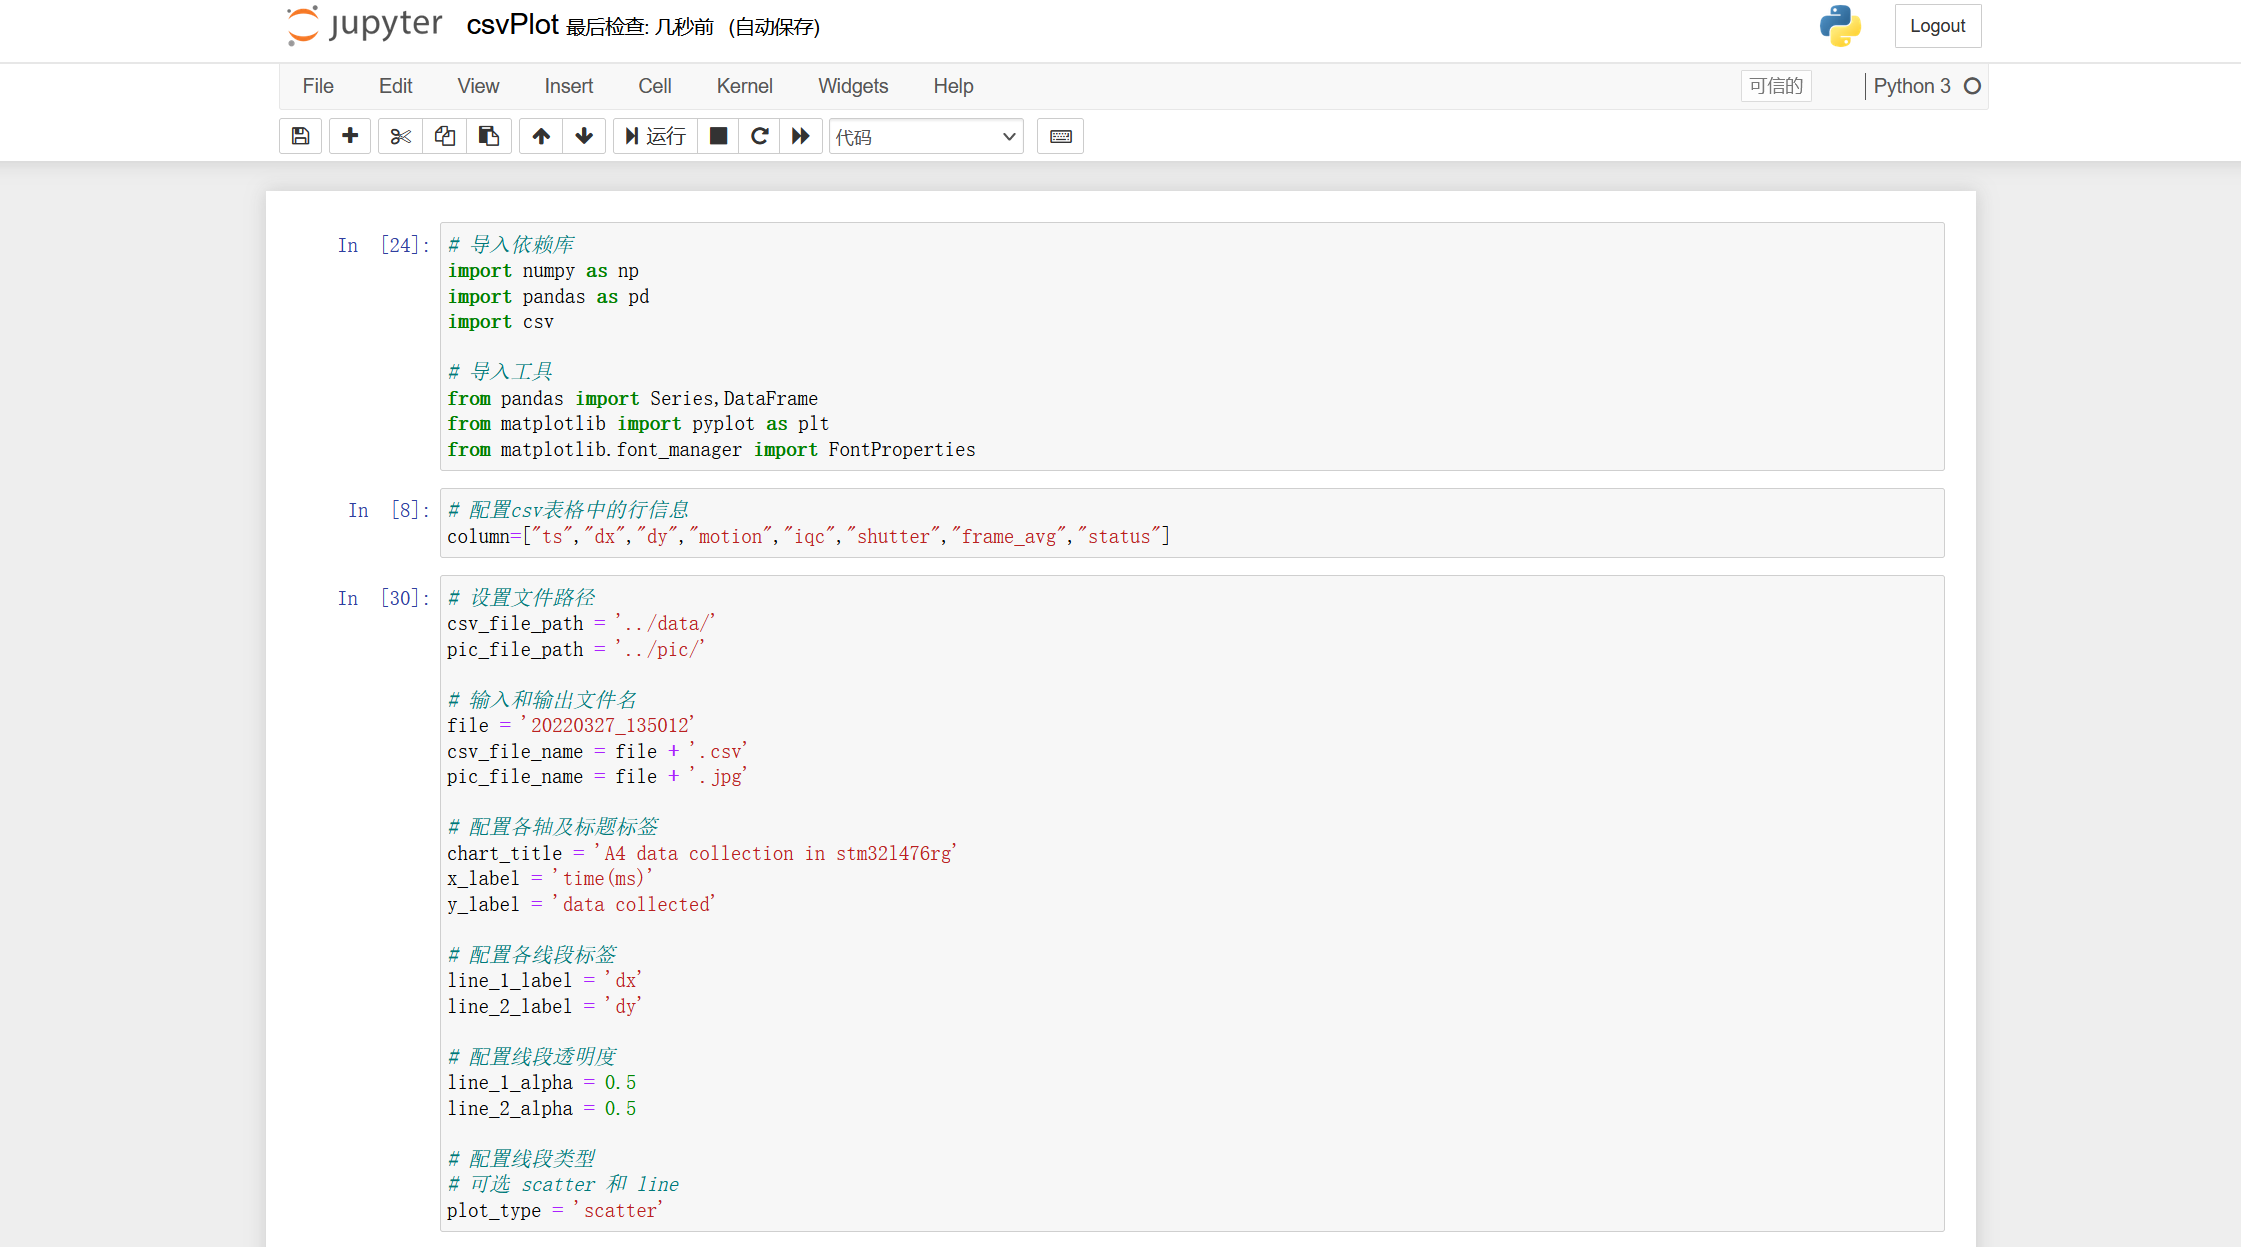
设置好后 在线版 Jupyter 编辑器的页面如下:

在线使用界面

离线安装

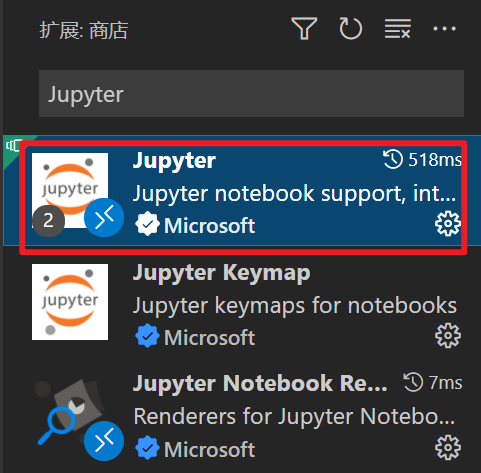
在 VS code 插件中搜索并安装第一个 Jupyter 即可,插件系统会自动安装下面附带的 Jupyter KeymapJupyter Notebook Renderers 两个插件。

image-20220327163752153

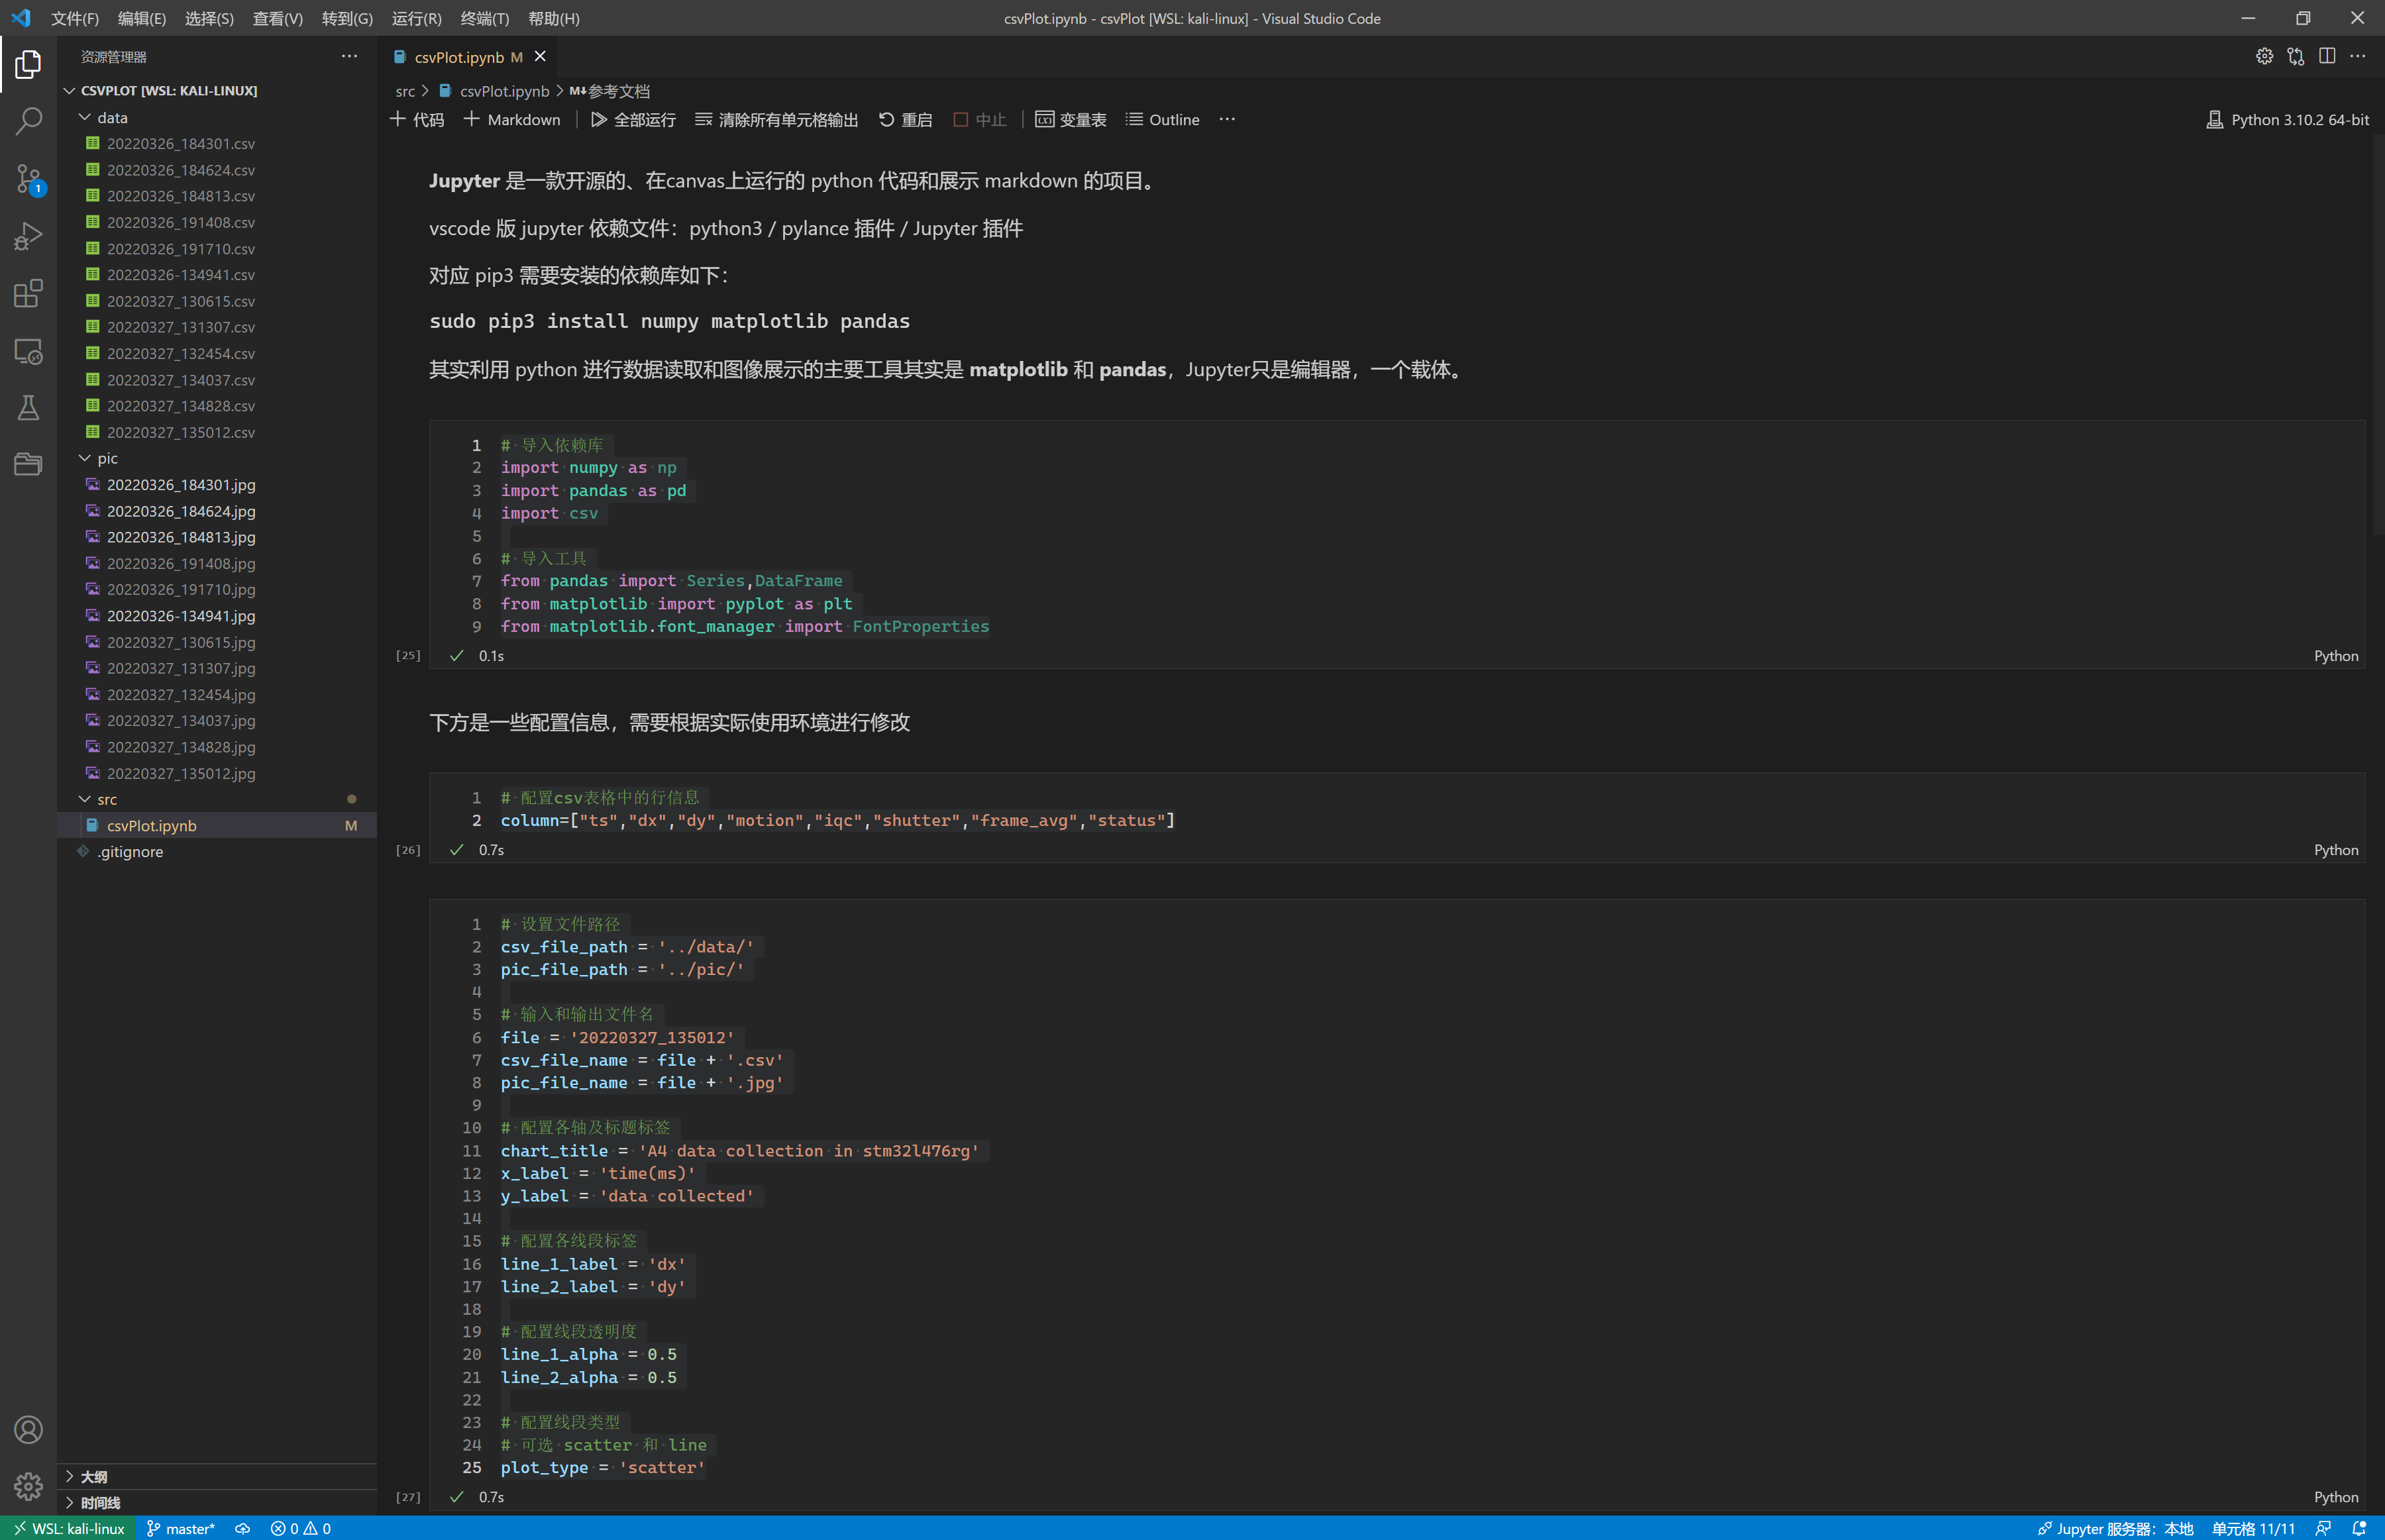
安装完之后,需要新建一个 .ipynb 格式的文件,即可自动打开 Jupyter 插件进行使用。

离线使用界面

PIP 依赖库安装

在线版和离线版都需要使用 terminal 打开并输入命令进行安装下方的依赖库:

1
pip3 install matplotlib pandas

图形生成代码

下方利用 pandas 类对 .csv 文件中的相关列进行数据提取,然后利用 matplotlib 类对 数据进行绘图。

因功能比较简单,不再赘述。

具体需要注意的事项已在代码注释中写明。

1
2
3
4
5
6
7
8
9
10
11
12
13
14
15
16
17
18
19
20
21
22
23
24
25
26
27
28
29
30
31
32
33
34
35
36
37
38
39
40
41
42
43
44
45
46
47
48
49
50
51
52
53
54
55
56
57
58
59
60
61
62
63
64
65
66
67
68
69
70
71
72
73
74
75
76
77
78
79
80
81
82
83
84
85
86
87
88
89
90
# 导入依赖库
import numpy as np
import pandas as pd
import csv

# 导入工具
from pandas import Series,DataFrame
from matplotlib import pyplot as plt
from matplotlib.font_manager import FontProperties

# 配置csv表格中的行信息
column=["ts","dx","dy","motion","iqc","shutter","frame_avg","status"]

# 设置文件路径
csv_file_path = '../data/'
pic_file_path = '../pic/'

# 输入和输出文件名
file = '20220327_135012'
csv_file_name = file + '.csv'
pic_file_name = file + '.jpg'

# 配置各轴及标题标签
chart_title = 'A4 data collection in stm32l476rg'
x_label = 'time(ms)'
y_label = 'data collected'

# 配置各线段标签
line_1_label = 'dx'
line_2_label = 'dy'

# 配置线段透明度
line_1_alpha = 0.5
line_2_alpha = 0.5

# 配置线段类型
# 可选 scatter 和 line
plot_type = 'scatter'

# 用于正常显示中文标签
plt.rcParams['font.sans-serif']=['YAHEI']
# 用于正常显示正负号
plt.rcParams['axes.unicode_minus']=False

# 定义空列表存放xy轴数据点
x = []
y = []
z = []

'''
# 可以使用open()方法对csv文件进行读取
# 但是暂时没有找到可以避免读取到头部信息的方法,即不能跳过部分数据进行读取
with open( csv_file_path + csv_file_name, 'r', encoding='utf8') as csv_file:
plots = csv.reader(csv_file, delimiter=',')
for row in plots:
x.append(int(row[0]))
y.append(int(row[1]))
z.append(int(row[2]))
'''

# 使用panda的read_csv()方法可以设置跳过部分数据进行处理
csv_file = pd.read_csv(csv_file_path + csv_file_name,
skiprows=21,
delimiter=',',
names=column)

# 将对应列数据放入变量中
x = csv_file['ts']
y = csv_file['dx']
z = csv_file['dy']

# 设置线段标签
if( plot_type=='line'):
plt.plot(x,y, label=line_1_label, alpha=line_1_alpha, lw=1)
plt.plot(x,z, label=line_2_label, alpha=line_2_alpha, lw=1)
elif( plot_type == 'scatter'):
plt.scatter(x,y, label=line_1_label, alpha=line_1_alpha, s=1)
plt.scatter(x,z, label=line_2_label, alpha=line_2_alpha, s=1)

# 设置x轴、y轴和标题标签
plt.xlabel(x_label)
plt.ylabel(y_label)
plt.title(chart_title)

# 展示图像
plt.legend()

# 图像保存
plt.savefig( pic_file_path + pic_file_name , dpi=400)
plt.show()

使用方法

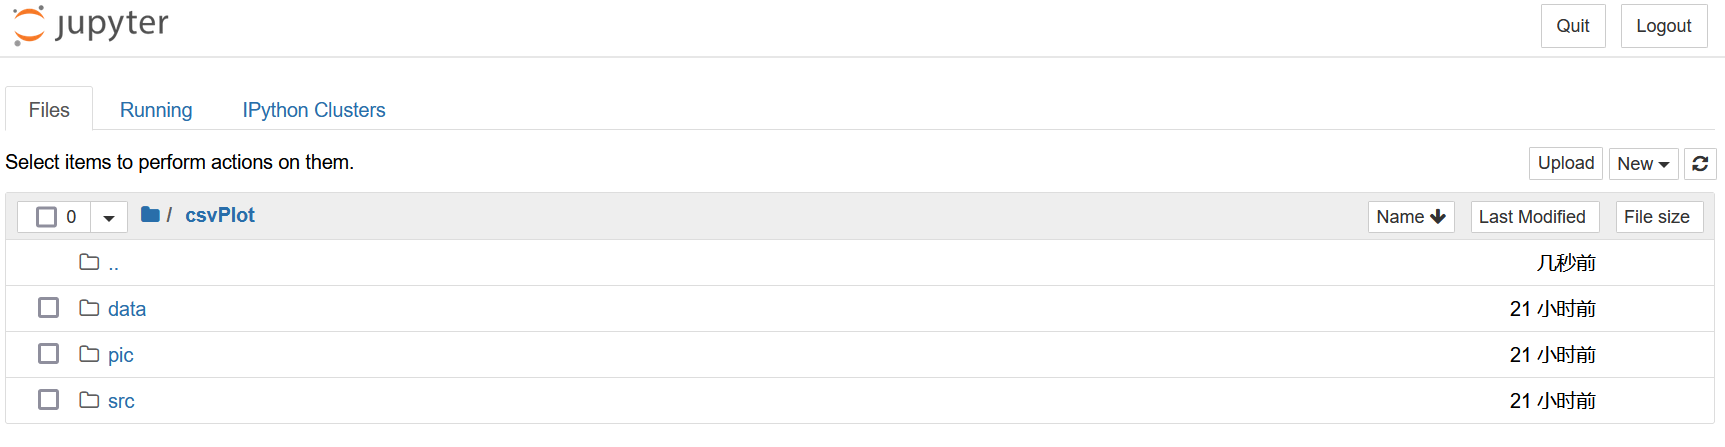
  1. 生成一个文件夹,下面包含三个并行子路径。
1
2
3
├── data
├── pic
└── src

网页版:

网页版文件结构示意
  1. 将代码放到 src/ 中,在将代码第19行中的 file = '20220327_135012' 文件名进行修改,确保其与 data/ 路径下的 .csv 文件名成可以对上。
  2. 执行整段代码,即可在 pic/ 文件夹下找到对应的图像文件。

REFERENCE

  1. vscode写jupyter notebook

  2. Pandas将csv数据拆分成多列并保存